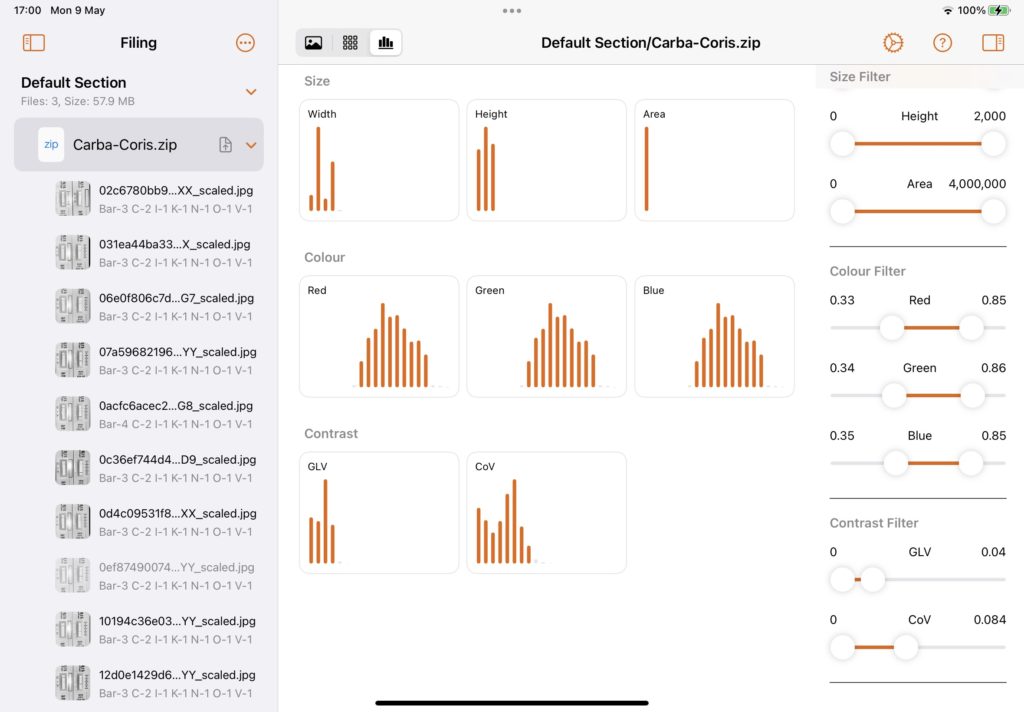
The statistics view displays a number of graphs (histograms) for various aspects of the labelled images or boxes. This can be especially useful when using the filtering options in the properties panel.

You may wish to filter some images / boxes depending on their size, colour ranges or the amount of contrast based on either their Grey Level Variance or their Coefficient of Variation. As the sliders for the filters are dragged so the histograms will update. Those images / boxes that are filtered are coloured grey in the histogram whereas the those that are included as coloured with the orange accent colour.
Image files that are filtered are shown as greyed out in the filing panel and these will not be included in any of the exported annotation files.

